Before you start
All examples on this page assume you have downloaded, configured and built APEX. See the Getting Started page for instructions on how to do that.
Simple example
In the APEX installation directory, there is a bin directory. In the bin directory are a number of examples, one of which is a simple matrix multiplication example, matmult.
To run the matmult example, simply type 'matmult'. The output should be something like this:
khuck@ktau:~/src/apex/install/bin$ ./matmult
Spawned thread 1...
Spawned thread 2...
Spawned thread 3...
Done.
Not very interesting, eh? To see what APEX measured, set the APEX_SCREEN_OUTPUT environment variable to 1, and run it again:
khuck@ktau:~/src/apex/install/bin$ export APEX_SCREEN_OUTPUT=1
khuck@ktau:~/src/apex/install/bin$ ./matmult
v0.1-e050e17-master
Built on: 14:38:56 Dec 22 2015
C++ Language Standard version : 201402
GCC Compiler version : 5.2.1 20151010
APEX_TAU : 0
APEX_POLICY : 1
APEX_MEASURE_CONCURRENCY : 0
APEX_MEASURE_CONCURRENCY_PERIOD : 1000000
APEX_SCREEN_OUTPUT : 1
APEX_PROFILE_OUTPUT : 0
APEX_CSV_OUTPUT : 1
APEX_TASKGRAPH_OUTPUT : 0
APEX_PROC_CPUINFO : 0
APEX_PROC_MEMINFO : 0
APEX_PROC_NET_DEV : 0
APEX_PROC_SELF_STATUS : 0
APEX_PROC_STAT : 1
APEX_THROTTLE_CONCURRENCY : 1
APEX_THROTTLING_MAX_THREADS : 8
APEX_THROTTLING_MIN_THREADS : 1
APEX_THROTTLE_ENERGY : 0
APEX_THROTTLING_MAX_WATTS : 300
APEX_THROTTLING_MIN_WATTS : 150
APEX_PTHREAD_WRAPPER_STACK_SIZE : 0
APEX_PAPI_METRICS :
Spawned thread 1...
Spawned thread 2...
Spawned thread 3...
Done.
CPU is 2.66013e+09 Hz.
Elapsed time: 0.966516
Cores detected: 8
Worker Threads observed: 4
Available CPU time: 3.86607
Action                         :  #calls  |  minimum |    mean  |  maximum |   total  |  stddev  |  % total
------------------------------------------------------------------------------------------------------------
                allocateMatrix :       12    --n/a--   1.94e-02    --n/a--   2.33e-01    --n/a--      6.014
                       compute :        4    --n/a--   6.89e-01    --n/a--   2.76e+00    --n/a--     71.279
           compute_interchange :        4    --n/a--   1.85e-01    --n/a--   7.38e-01    --n/a--     19.091
                       do_work :        4    --n/a--   9.43e-01    --n/a--   3.77e+00    --n/a--     97.601
                    freeMatrix :       12    --n/a--   2.36e-04    --n/a--   2.83e-03    --n/a--      0.073
                    initialize :       12    --n/a--   3.56e-03    --n/a--   4.27e-02    --n/a--      1.104
                          main :        1    --n/a--   9.66e-01    --n/a--   9.66e-01    --n/a--     24.983
                     APEX Idle :  --n/a--    --n/a--    --n/a--    --n/a--    --n/a--    --n/a--    --n/a--
------------------------------------------------------------------------------------------------------------
In this output, we see the status of all of the environment variables (as read by APEX at initialization), the regular program output, and then a summary from APEX at the end. Because APEX captures timestamps using the low-overhead rdtsc function call (where available), the measurements are done in cycles. APEX estimates the Hz rating of the CPU to convert to seconds for output. APEX reports the elapsed wall-clock time, the number of cores detected, the number of worker threads observed, as well as the total available CPU time (wall-clock times workers).
OpenMP example
In the APEX installation directory, there is a bin directory. In the bin directory are a number of examples, one of which is the OpenMP implementation of LULESH (for details, see the LLNL explanation of LULESH). When APEX is configured with OpenMP OMPT support (using the -DBUILD_OMPT=TRUE or equivalent CMake configuration settings) it will measure OpenMP events. Executing the LULESH example (with APEX_SCREEN_OUTPUT=1) gives the following output:
khuck@ktau:~/src/apex$ ./install/bin/lulesh_OpenMP_2.0
v0.1-e050e17-master
Built on: 14:38:56 Dec 22 2015
C++ Language Standard version : 201402
GCC Compiler version : 5.2.1 20151010
APEX_TAU : 0
APEX_POLICY : 1
APEX_MEASURE_CONCURRENCY : 0
APEX_MEASURE_CONCURRENCY_PERIOD : 1000000
APEX_SCREEN_OUTPUT : 1
APEX_PROFILE_OUTPUT : 0
APEX_CSV_OUTPUT : 1
APEX_TASKGRAPH_OUTPUT : 0
APEX_PROC_CPUINFO : 0
APEX_PROC_MEMINFO : 0
APEX_PROC_NET_DEV : 0
APEX_PROC_SELF_STATUS : 0
APEX_PROC_STAT : 1
APEX_THROTTLE_CONCURRENCY : 1
APEX_THROTTLING_MAX_THREADS : 8
APEX_THROTTLING_MIN_THREADS : 1
APEX_THROTTLE_ENERGY : 0
APEX_THROTTLING_MAX_WATTS : 300
APEX_THROTTLING_MIN_WATTS : 150
APEX_PTHREAD_WRAPPER_STACK_SIZE : 0
APEX_PAPI_METRICS :
Running problem size 30^3 per domain until completion
Num processors: 1
Registering OMPT events...done.
Num threads: 8
Total number of elements: 27000

To run other sizes, use -s <integer>.
To run a fixed number of iterations, use -i <integer>.
To run a more or less balanced region set, use -b <integer>.
To change the relative costs of regions, use -c <integer>.
To print out progress, use -p
To write an output file for VisIt, use -v
See help (-h) for more options

APEX: disabling lightweight timer OpenMP_BARRIER: CalcPressur...
APEX: disabling lightweight timer OpenMP_BARRIER: CalcPressur...
APEX: disabling lightweight timer OpenMP_BARRIER: EvalEOSForE...
APEX: disabling lightweight timer OpenMP_BARRIER: CalcEnergyF...
APEX: disabling lightweight timer OpenMP_BARRIER: CalcEnergyF...
APEX: disabling lightweight timer OpenMP_BARRIER: CalcEnergyF...
APEX: disabling lightweight timer OpenMP_BARRIER: CalcEnergyF...
APEX: disabling lightweight timer OpenMP_BARRIER: CalcEnergyF...
APEX: disabling lightweight timer OpenMP_BARRIER: CalcCourant...
APEX: disabling lightweight timer OpenMP_BARRIER: CalcHydroCo...
APEX: disabling lightweight timer OpenMP_BARRIER: CalcMonoton...
APEX: disabling lightweight timer OpenMP_BARRIER: EvalEOSForE...
APEX: disabling lightweight timer OpenMP_BARRIER: CalcSoundSp...
APEX: disabling lightweight timer OpenMP_BARRIER: InitStressT...
APEX: disabling lightweight timer OpenMP_BARRIER: CalcVolumeF...
APEX: disabling lightweight timer OpenMP_BARRIER: CalcAcceler...
APEX: disabling lightweight timer OpenMP_BARRIER: CalcVelocit...
APEX: disabling lightweight timer OpenMP_BARRIER: CalcPositio...
APEX: disabling lightweight timer OpenMP_BARRIER: CalcLagrang...
APEX: disabling lightweight timer OpenMP_BARRIER: UpdateVolum...
APEX: disabling lightweight timer OpenMP_BARRIER: ApplyAccele...
APEX: disabling lightweight timer OpenMP_BARRIER: CalcForceFo...
Run completed:
   Problem size        =  30
   MPI tasks           =  1
   Iteration count     =  932
   Final Origin Energy = 2.025075e+05
   Testing Plane 0 of Energy Array on rank 0:
        MaxAbsDiff   = 6.548362e-11
        TotalAbsDiff = 8.615093e-10
        MaxRelDiff   = 1.461140e-12


Elapsed time         =      55.00 (s)
Grind time (us/z/c)  =  2.1855548 (per dom)  ( 2.1855548 overall)
FOM                  =  457.54973 (z/s)

CPU is 2.66013e+09 Hz.
Elapsed time: 55.0085
Cores detected: 8
Worker Threads observed: 8
Available CPU time: 440.068
Action                         :  #calls  |  minimum |    mean  |  maximum |   total  |  stddev  |  % total
------------------------------------------------------------------------------------------------------------
                   CPU Guest % :       54      0.000      0.000      0.000      0.000      0.000    --n/a--
                CPU I/O Wait % :       54      0.000      0.040      0.714      2.143      0.133    --n/a--
                     CPU IRQ % :       54      0.000      0.000      0.000      0.000      0.000    --n/a--
                    CPU Idle % :       54      0.857      1.384      4.857     74.714      0.763    --n/a--
                    CPU Nice % :       54      0.000      0.000      0.000      0.000      0.000    --n/a--
                   CPU Steal % :       54      0.000      0.000      0.000      0.000      0.000    --n/a--
                  CPU System % :       54     15.286     23.339     26.714   1260.286      2.301    --n/a--
                    CPU User % :       54     84.143     88.373     97.143   4772.143      2.268    --n/a--
                CPU soft IRQ % :       54      0.000      0.026      0.286      1.429      0.068    --n/a--
OpenMP_BARRIER: ApplyAccele... : DISABLED (high frequency, short duration)
OpenMP_BARRIER: ApplyMateri... :    14912    --n/a--   3.96e-05    --n/a--   5.91e-01    --n/a--      0.134
OpenMP_BARRIER: CalcAcceler... : DISABLED (high frequency, short duration)
OpenMP_BARRIER: CalcCourant... : DISABLED (high frequency, short duration)
OpenMP_BARRIER: CalcEnergyF... : DISABLED (high frequency, short duration)
OpenMP_BARRIER: CalcEnergyF... : DISABLED (high frequency, short duration)
OpenMP_BARRIER: CalcEnergyF... : DISABLED (high frequency, short duration)
OpenMP_BARRIER: CalcEnergyF... : DISABLED (high frequency, short duration)
OpenMP_BARRIER: CalcEnergyF... : DISABLED (high frequency, short duration)
OpenMP_BARRIER: CalcFBHourg... :     7456    --n/a--   1.11e-04    --n/a--   8.27e-01    --n/a--      0.188
OpenMP_BARRIER: CalcFBHourg... :     7456    --n/a--   1.49e-04    --n/a--   1.11e+00    --n/a--      0.252
OpenMP_BARRIER: CalcForceFo... : DISABLED (high frequency, short duration)
OpenMP_BARRIER: CalcHourgla... :     7456    --n/a--   1.32e-04    --n/a--   9.84e-01    --n/a--      0.224
OpenMP_BARRIER: CalcHydroCo... : DISABLED (high frequency, short duration)
OpenMP_BARRIER: CalcKinemat... :     7456    --n/a--   7.88e-05    --n/a--   5.88e-01    --n/a--      0.134
OpenMP_BARRIER: CalcLagrang... : DISABLED (high frequency, short duration)
OpenMP_BARRIER: CalcMonoton... :     7456    --n/a--   6.98e-05    --n/a--   5.21e-01    --n/a--      0.118
OpenMP_BARRIER: CalcMonoton... : DISABLED (high frequency, short duration)
OpenMP_BARRIER: CalcPositio... : DISABLED (high frequency, short duration)
OpenMP_BARRIER: CalcPressur... : DISABLED (high frequency, short duration)
OpenMP_BARRIER: CalcPressur... : DISABLED (high frequency, short duration)
OpenMP_BARRIER: CalcSoundSp... : DISABLED (high frequency, short duration)
OpenMP_BARRIER: CalcVelocit... : DISABLED (high frequency, short duration)
OpenMP_BARRIER: CalcVolumeF... : DISABLED (high frequency, short duration)
OpenMP_BARRIER: EvalEOSForE... : DISABLED (high frequency, short duration)
OpenMP_BARRIER: EvalEOSForE... : DISABLED (high frequency, short duration)
OpenMP_BARRIER: InitStressT... : DISABLED (high frequency, short duration)
OpenMP_BARRIER: IntegrateSt... :     7456    --n/a--   6.66e-05    --n/a--   4.97e-01    --n/a--      0.113
OpenMP_BARRIER: IntegrateSt... :     7456    --n/a--   1.28e-04    --n/a--   9.54e-01    --n/a--      0.217
OpenMP_BARRIER: UpdateVolum... : DISABLED (high frequency, short duration)
OpenMP_PARALLEL_REGION: App... :      932    --n/a--   1.09e-04    --n/a--   1.01e-01    --n/a--      0.023
OpenMP_PARALLEL_REGION: App... :      932    --n/a--   2.58e-04    --n/a--   2.40e-01    --n/a--      0.055
OpenMP_PARALLEL_REGION: Cal... :      932    --n/a--   7.83e-04    --n/a--   7.30e-01    --n/a--      0.166
OpenMP_PARALLEL_REGION: Cal... :    10252    --n/a--   7.72e-05    --n/a--   7.91e-01    --n/a--      0.180
OpenMP_PARALLEL_REGION: Cal... :    32620    --n/a--   4.29e-05    --n/a--   1.40e+00    --n/a--      0.318
OpenMP_PARALLEL_REGION: Cal... :    32620    --n/a--   5.07e-05    --n/a--   1.65e+00    --n/a--      0.376
OpenMP_PARALLEL_REGION: Cal... :    32620    --n/a--   3.31e-05    --n/a--   1.08e+00    --n/a--      0.245
OpenMP_PARALLEL_REGION: Cal... :    32620    --n/a--   4.75e-05    --n/a--   1.55e+00    --n/a--      0.352
OpenMP_PARALLEL_REGION: Cal... :    32620    --n/a--   4.09e-05    --n/a--   1.34e+00    --n/a--      0.303
OpenMP_PARALLEL_REGION: Cal... :      932    --n/a--   8.10e-03    --n/a--   7.55e+00    --n/a--      1.715
OpenMP_PARALLEL_REGION: Cal... :      932    --n/a--   3.51e-03    --n/a--   3.28e+00    --n/a--      0.744
OpenMP_PARALLEL_REGION: Cal... :      932    --n/a--   4.34e-04    --n/a--   4.05e-01    --n/a--      0.092
OpenMP_PARALLEL_REGION: Cal... :      932    --n/a--   4.27e-03    --n/a--   3.98e+00    --n/a--      0.905
OpenMP_PARALLEL_REGION: Cal... :    10252    --n/a--   4.72e-05    --n/a--   4.84e-01    --n/a--      0.110
OpenMP_PARALLEL_REGION: Cal... :      932    --n/a--   1.68e-03    --n/a--   1.57e+00    --n/a--      0.356
OpenMP_PARALLEL_REGION: Cal... :      932    --n/a--   2.29e-04    --n/a--   2.13e-01    --n/a--      0.048
OpenMP_PARALLEL_REGION: Cal... :      932    --n/a--   1.15e-03    --n/a--   1.07e+00    --n/a--      0.244
OpenMP_PARALLEL_REGION: Cal... :    10252    --n/a--   2.29e-04    --n/a--   2.34e+00    --n/a--      0.533
OpenMP_PARALLEL_REGION: Cal... :      932    --n/a--   4.98e-04    --n/a--   4.64e-01    --n/a--      0.105
OpenMP_PARALLEL_REGION: Cal... :    97860    --n/a--   3.26e-05    --n/a--   3.19e+00    --n/a--      0.725
OpenMP_PARALLEL_REGION: Cal... :    97860    --n/a--   3.20e-05    --n/a--   3.13e+00    --n/a--      0.712
OpenMP_PARALLEL_REGION: Cal... :    10252    --n/a--   4.52e-05    --n/a--   4.63e-01    --n/a--      0.105
OpenMP_PARALLEL_REGION: Cal... :      932    --n/a--   3.39e-04    --n/a--   3.16e-01    --n/a--      0.072
OpenMP_PARALLEL_REGION: Cal... :      932    --n/a--   1.57e-04    --n/a--   1.47e-01    --n/a--      0.033
OpenMP_PARALLEL_REGION: Eva... :    32620    --n/a--   1.07e-04    --n/a--   3.50e+00    --n/a--      0.796
OpenMP_PARALLEL_REGION: Eva... :    10252    --n/a--   2.86e-05    --n/a--   2.93e-01    --n/a--      0.067
OpenMP_PARALLEL_REGION: Ini... :      932    --n/a--   3.52e-04    --n/a--   3.28e-01    --n/a--      0.074
OpenMP_PARALLEL_REGION: Int... :      932    --n/a--   3.14e-03    --n/a--   2.93e+00    --n/a--      0.666
OpenMP_PARALLEL_REGION: Int... :      932    --n/a--   2.18e-03    --n/a--   2.03e+00    --n/a--      0.461
OpenMP_PARALLEL_REGION: Upd... :      932    --n/a--   1.34e-04    --n/a--   1.25e-01    --n/a--      0.028
                     APEX Idle :  --n/a--    --n/a--    --n/a--    --n/a--   3.87e+02    --n/a--     88.011
------------------------------------------------------------------------------------------------------------
There are several lightweight events that APEX elects to ignore. The other events are timed by APEX and reported at exit, along with the /proc/stat data (CPU % counters).
With PAPI
When APEX is configured with PAPI support (using -DPAPI_ROOT=/path/to/papi and -DUSE_PAPI=TRUE), hardware counter data can also be collected by APEX. To specify hardware counters of interest, use the APEX_PAPI_METRICS environment variable:
khuck@ktau:~/src/apex$ export APEX_PAPI_METRICS="PAPI_TOT_INS PAPI_L2_TCM"
...and then execute as normal:
khuck@ktau:~/src/apex$ ./install/bin/matmult
v0.1-e050e17-master
Built on: 14:38:56 Dec 22 2015
C++ Language Standard version : 201402
GCC Compiler version : 5.2.1 20151010
APEX_TAU : 1
APEX_POLICY : 1
APEX_MEASURE_CONCURRENCY : 0
APEX_MEASURE_CONCURRENCY_PERIOD : 1000000
APEX_SCREEN_OUTPUT : 1
APEX_PROFILE_OUTPUT : 0
APEX_CSV_OUTPUT : 1
APEX_TASKGRAPH_OUTPUT : 0
APEX_PROC_CPUINFO : 0
APEX_PROC_MEMINFO : 0
APEX_PROC_NET_DEV : 0
APEX_PROC_SELF_STATUS : 0
APEX_PROC_STAT : 1
APEX_THROTTLE_CONCURRENCY : 1
APEX_THROTTLING_MAX_THREADS : 8
APEX_THROTTLING_MIN_THREADS : 1
APEX_THROTTLE_ENERGY : 0
APEX_THROTTLING_MAX_WATTS : 300
APEX_THROTTLING_MIN_WATTS : 150
APEX_PTHREAD_WRAPPER_STACK_SIZE : 0
APEX_PAPI_METRICS : PAPI_TOT_INS PAPI_L2_TCM
Spawned thread 1...
Spawned thread 2...
Spawned thread 3...
Done.
CPU is 2.66019e+09 Hz.
Elapsed time: 0.954974
Cores detected: 8
Worker Threads observed: 4
Available CPU time: 3.81989
Action                         :  #calls  |  minimum |    mean  |  maximum |   total  |  stddev  |  % total  PAPI_TOT_INS PAPI_L2_TCM
------------------------------------------------------------------------------------------------------------
                allocateMatrix :       12    --n/a--   2.21e-02    --n/a--   2.65e-01    --n/a--      6.930   1.62e+06   9.10e+03
                       compute :        4    --n/a--   6.85e-01    --n/a--   2.74e+00    --n/a--     71.743   4.31e+09   1.71e+06
           compute_interchange :        4    --n/a--   1.81e-01    --n/a--   7.23e-01    --n/a--     18.922   3.77e+09   8.12e+05
                       do_work :        4    --n/a--   9.44e-01    --n/a--   3.78e+00    --n/a--     98.851   8.10e+09   2.92e+06
                    freeMatrix :       12    --n/a--   2.07e-04    --n/a--   2.49e-03    --n/a--      0.065   1.13e+06   6.30e+03
                    initialize :       12    --n/a--   3.58e-03    --n/a--   4.29e-02    --n/a--      1.124   2.21e+07   3.80e+05
                          main :        1    --n/a--   9.54e-01    --n/a--   9.54e-01    --n/a--     24.978   2.03e+09   7.66e+05
                     APEX Idle :  --n/a--    --n/a--    --n/a--    --n/a--    --n/a--    --n/a--    --n/a--
------------------------------------------------------------------------------------------------------------
CSV output
While APEX is not designed for post-mortem performance analysis, you can export the data that APEX collected. If you set the APEX_CSV_OUTPUT environment variable to 1, APEX will also dump the timer statistics as a CSV file:
khuck@ktau:~/src/apex$ cat apex.0.csv
"task","num calls","total cycles","total microseconds","PAPI_TOT_INS","PAPI_L2_TCM"
"allocateMatrix",12,704195504,264717,1615804,9100
"compute",4,7290209200,2740489,4306522734,1709040
"compute_interchange",4,1922797744,722806,3769652571,812196
"do_work",4,10044907856,3776018,8101109302,2922142
"freeMatrix",12,6613336,2486,1132717,6301
"initialize",12,114177592,42921,22093639,379785
"main",1,2538202992,954145,2025172707,766218
With TAU
If APEX is configured with TAU support, then APEX measurements will be forwarded to TAU and recorded as a TAU profile. In addition, all other TAU features are supported, including sampling, MPI measurement, I/O measurement, tracing, etc. To configure APEX with TAU, specify the flags -DUSE_TAU, -DTAU_ROOT, -DTAU_ARCH, and -DTAU_OPTIONS. For example, if TAU was configured with "./configure -pthread" on an x86_64 Linux machine, the APEX configuration options would be "-DUSE_TAU=1 -DTAU_ROOT=/path/to/tau -DTAU_ARCH=x86_64 -DTAU_OPTIONS=-pthread". If TAU was configured with "./configure -mpi -pthread" on an x86_64 Linux machine, the APEX configuration options would be "-DUSE_TAU=1 -DTAU_ROOT=/path/to/tau -DTAU_ARCH=x86_64 -DTAU_OPTIONS=-mpi-pthread".
Here is a suggested configuration for TAU on x86-Linux to use with APEX (some systems require special flags - please contact the maintaners if you are interested):
# download the latest TAU release
wget http://www.cs.uoregon.edu/research/paracomp/tau/tauprofile/dist/tau_latest.tar.gz
# expand the tar file
tar -xvzf tau_latest.tar.gz
cd tau-2.25
# configure TAU
./configure -papi=/usr/local/papi/5.3.2 -pthread -prefix=/usr/local/tau/2.25
# build
make -j install
# set our path to include the new TAU installation
export PATH=$PATH:/usr/local/tau/2.25/x86_64/bin
Here is a suggested configuration for APEX to use the above TAU installation:
cd xpress-apex
mkdir build-tau
cd build-tau
cmake -DBUILD_EXAMPLES=TRUE -DBUILD_TESTS=TRUE -DCMAKE_BUILD_TYPE=RelWithDebInfo \
-DUSE_TAU=TRUE -DTAU_ROOT=/usr/local/tau/2.25 -DTAU_ARCH=x86_64 -DTAU_OPTIONS=-papi-pthread \
-DBUILD_BFD=TRUE -DBUILD_ACTIVEHARMONY=TRUE -DCMAKE_INSTALL_PREFIX=../install-tau ..
make
make tests
make install
After configuring, building and installing TAU and then configuring, building and installing APEX, the TAU profiling is enabled by setting the environment variable "APEX_TAU=1". After executing an example (say 'matmult'), there should be profile.* files in the working directory:
khuck@ktau:~/src/xpress-apex$ export APEX_TAU=1
khuck@ktau:~/src/xpress-apex$ ./install/bin/matmult
Spawned thread 1...
Spawned thread 2...
Spawned thread 3...
Done.
khuck@ktau:~/src/xpress-apex$ ls profile.*
profile.0.0.0  profile.0.0.1  profile.0.0.2  profile.0.0.3  profile.0.0.4  profile.0.0.5
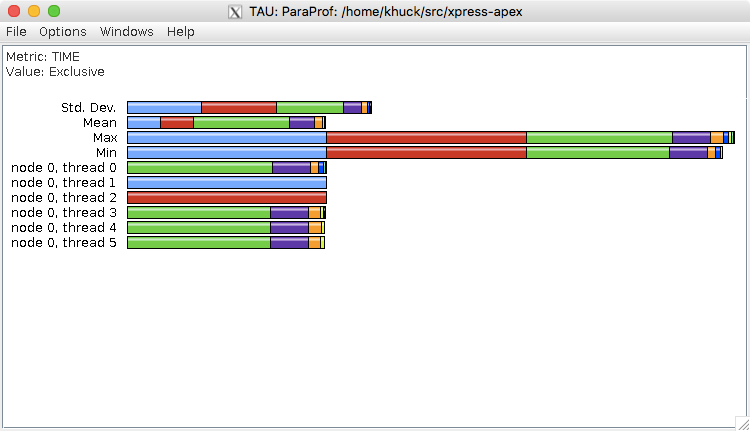
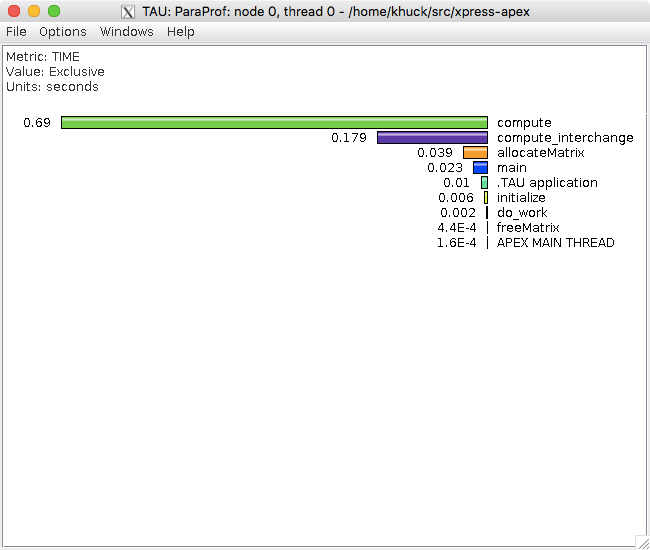
If the TAU analysis utilties are in your path, you can execute paraprof to view the profiles:
khuck@ktau:~/src/xpress-apex$ paraprof
...which should launch the ParaProf profile viewer/analysis program. The profile should look something like the following (for a complete manual on using ParaProf, see the TAU website).
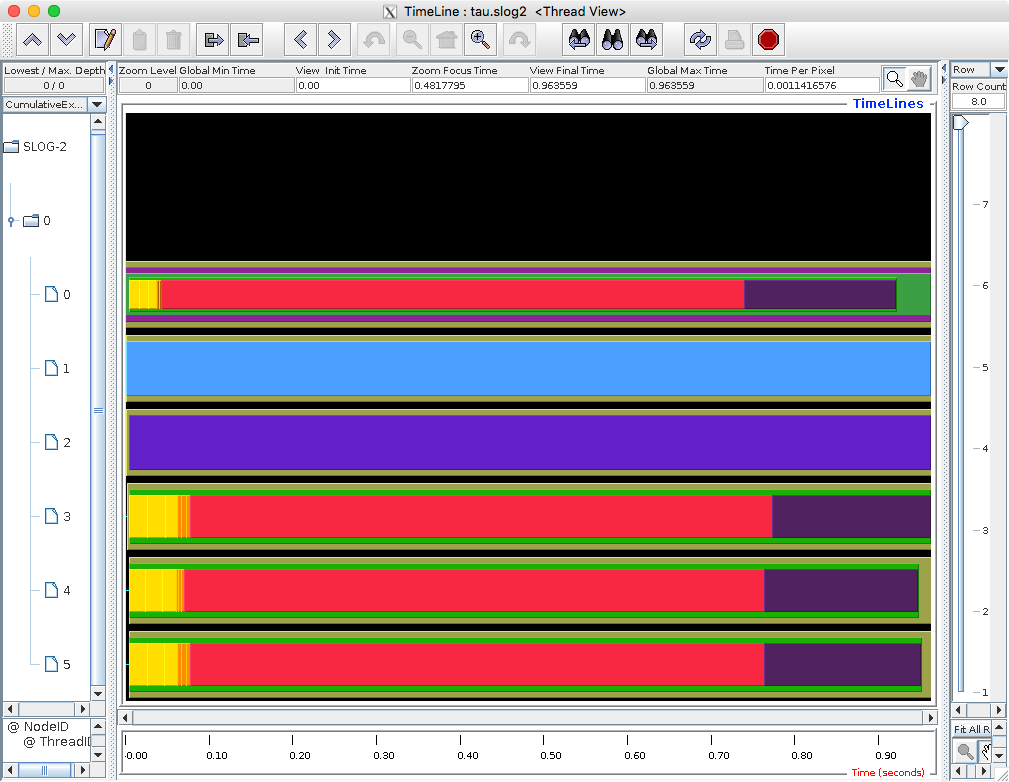
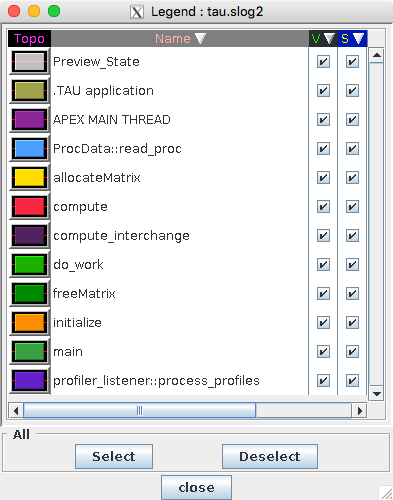
If you want to collect a TAU trace, you would enable the appropriate TAU environment variable (TAU_TRACE=1), and then re-run the example. After the execution, the trace files need to be merged (using tau_treemerge.pl) and then converted (with tau2slog2) to be viewed with the Jumpshot trace viewer (included with TAU):
khuck@ktau:~/src/xpress-apex$ export APEX_TAU=1
khuck@ktau:~/src/xpress-apex$ export TAU_TRACE=1
khuck@ktau:~/src/xpress-apex$ ./install/bin/matmult
Spawned thread 1...
Spawned thread 2...
Spawned thread 3...
Done.
khuck@ktau:~/src/xpress-apex$ ls *.edf *.trc
events.0.edf        tautrace.0.0.1.trc  tautrace.0.0.3.trc  tautrace.0.0.5.trc
tautrace.0.0.0.trc  tautrace.0.0.2.trc  tautrace.0.0.4.trc

# merge the trace
khuck@ktau:~/src/xpress-apex$ tau_treemerge.pl
/home/khuck/src/tau2/x86_64/bin/tau_merge -m tau.edf -e events.0.edf events.0.edf events.0.edf events.0.edf events.0.edf events.0.edf tautrace.0.0.0.trc tautrace.0.0.1.trc tautrace.0.0.2.trc tautrace.0.0.3.trc tautrace.0.0.4.trc tautrace.0.0.5.trc tau.trc
tautrace.0.0.0.trc: 34 records read.
tautrace.0.0.1.trc: 8 records read.
tautrace.0.0.2.trc: 8 records read.
tautrace.0.0.3.trc: 30 records read.
tautrace.0.0.4.trc: 30 records read.
tautrace.0.0.5.trc: 30 records read.

# convert the trace
khuck@ktau:~/src/xpress-apex$ tau2slog2 tau.trc tau.edf -o tau.slog2
140 records initialized.  Processing.
2 Records read. 1% converted
4 Records read. 2% converted
6 Records read. 4% converted
8 Records read. 5% converted
10 Records read. 7% converted
12 Records read. 8% converted
14 Records read. 10% converted
16 Records read. 11% converted
18 Records read. 12% converted
20 Records read. 14% converted
22 Records read. 15% converted
24 Records read. 17% converted
26 Records read. 18% converted
28 Records read. 20% converted
30 Records read. 21% converted
32 Records read. 22% converted
34 Records read. 24% converted
36 Records read. 25% converted
38 Records read. 27% converted
40 Records read. 28% converted
42 Records read. 30% converted
44 Records read. 31% converted
46 Records read. 32% converted
48 Records read. 34% converted
50 Records read. 35% converted
52 Records read. 37% converted
54 Records read. 38% converted
56 Records read. 40% converted
58 Records read. 41% converted
60 Records read. 42% converted
62 Records read. 44% converted
64 Records read. 45% converted
66 Records read. 47% converted
68 Records read. 48% converted
70 Records read. 50% converted
72 Records read. 51% converted
74 Records read. 52% converted
76 Records read. 54% converted
78 Records read. 55% converted
80 Records read. 57% converted
82 Records read. 58% converted
84 Records read. 60% converted
86 Records read. 61% converted
88 Records read. 62% converted
90 Records read. 64% converted
92 Records read. 65% converted
94 Records read. 67% converted
96 Records read. 68% converted
98 Records read. 70% converted
100 Records read. 71% converted
102 Records read. 72% converted
104 Records read. 74% converted
106 Records read. 75% converted
108 Records read. 77% converted
110 Records read. 78% converted
112 Records read. 80% converted
114 Records read. 81% converted
116 Records read. 82% converted
118 Records read. 84% converted
120 Records read. 85% converted
122 Records read. 87% converted
124 Records read. 88% converted
1521 enters: 0 exits: 0
126 Records read. 90% converted
1521 enters: 0 exits: 0
128 Records read. 91% converted
130 Records read. 92% converted
1521 enters: 0 exits: 0
132 Records read. 94% converted
1521 enters: 0 exits: 0
134 Records read. 95% converted
136 Records read. 97% converted
1521 enters: 0 exits: 0
138 Records read. 98% converted
1521 enters: 0 exits: 0
140 Records read. 100% converted
Reached end of trace file.
Getting YMap, Maxnode: 0, Maxthread: 5
     SLOG-2 Header:
version = SLOG 2.0.6
NumOfChildrenPerNode = 2
TreeLeafByteSize = 65536
MaxTreeDepth = 0
MaxBufferByteSize = 1960
Categories  is FBinfo(641 @ 2068)
MethodDefs  is FBinfo(0 @ 0)
LineIDMaps  is FBinfo(197 @ 2709)
TreeRoot    is FBinfo(1960 @ 108)
TreeDir     is FBinfo(38 @ 2906)
Annotations is FBinfo(0 @ 0)
Postamble   is FBinfo(0 @ 0)

1521 enters: 0 exits: 0

Number of Drawables = 58
timeElapsed between 1 & 2 = 67 msec
timeElapsed between 2 & 3 = 28 msec

# open jumpshot
khuck@ktau:~/src/xpress-apex$ jumpshot tau.slog2
Policy Rules and Runtime Adaptation
...Coming soon!